
Owner Dashboard
![]()
We're delighted to introduce the new 'Owner Dashboard' feature for our property owners. This feature serves as a pivotal tool, offering essential metrics including average booking length, total bookings, and revenue generation, categorised by both month and season. By providing this comprehensive data, we aim to cultivate a deeper understanding of customer behavior and preferences, empowering owners, with our guidance and cooperation, to help make informed decisions to enhance property performance.
Furthermore, the Owner Dashboard offers a holistic perspective on performance metrics, revenue trends, and occupancy rates. Through leveraging these insights, we facilitate owners in understanding their property's performance trajectory, identifying growth opportunities such as adjusting nightly rates, and improving customer satisfaction by incorporating guest feedback. These strategies are integral to achieving sustainable success in today's dynamic marketplace.
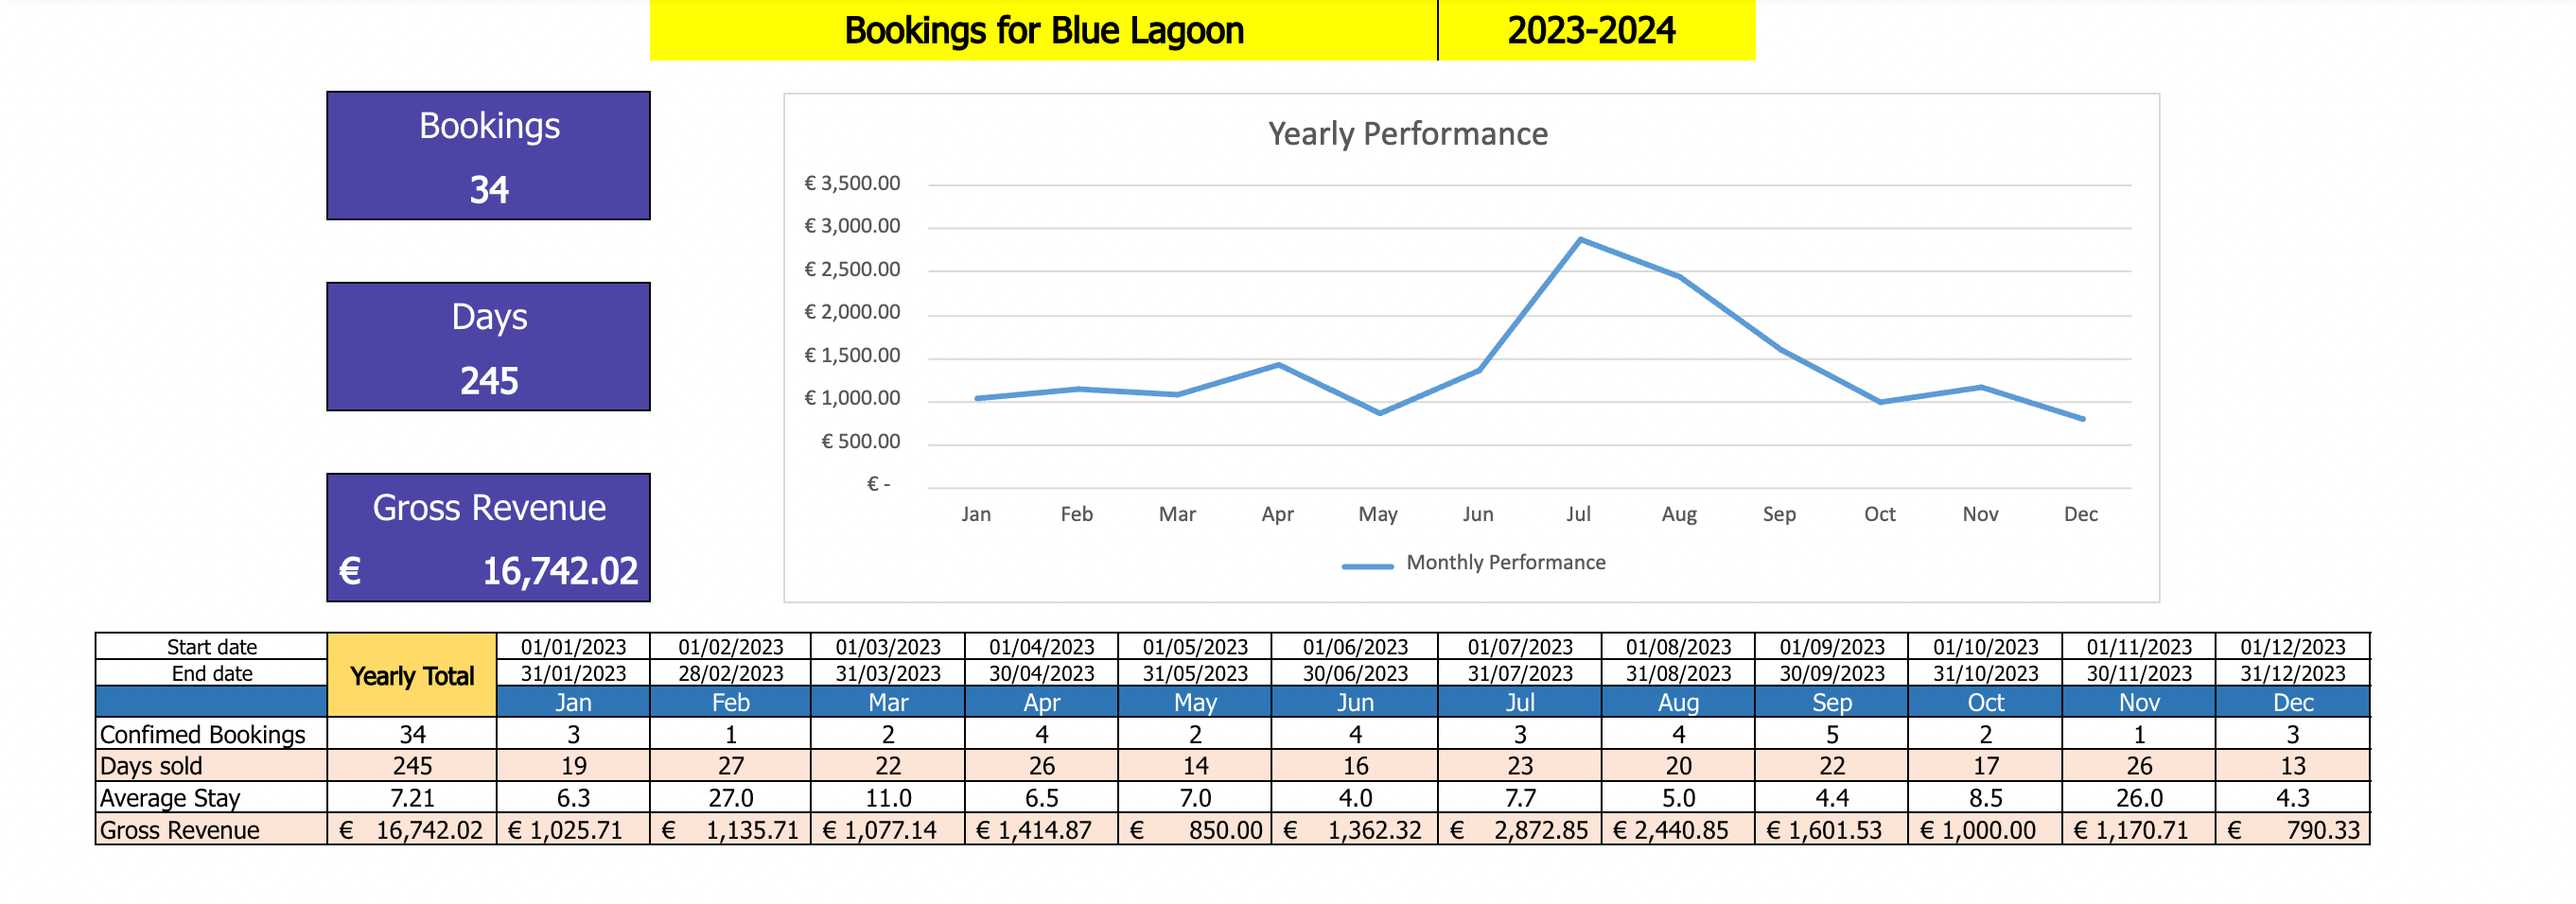
YEARLY PERFORMANCE
The initial line graph and table present concise and visually accessible information regarding the property's overall performance, including bookings taken, days sold, average stay, and gross revenue generated on a month-to-month basis.
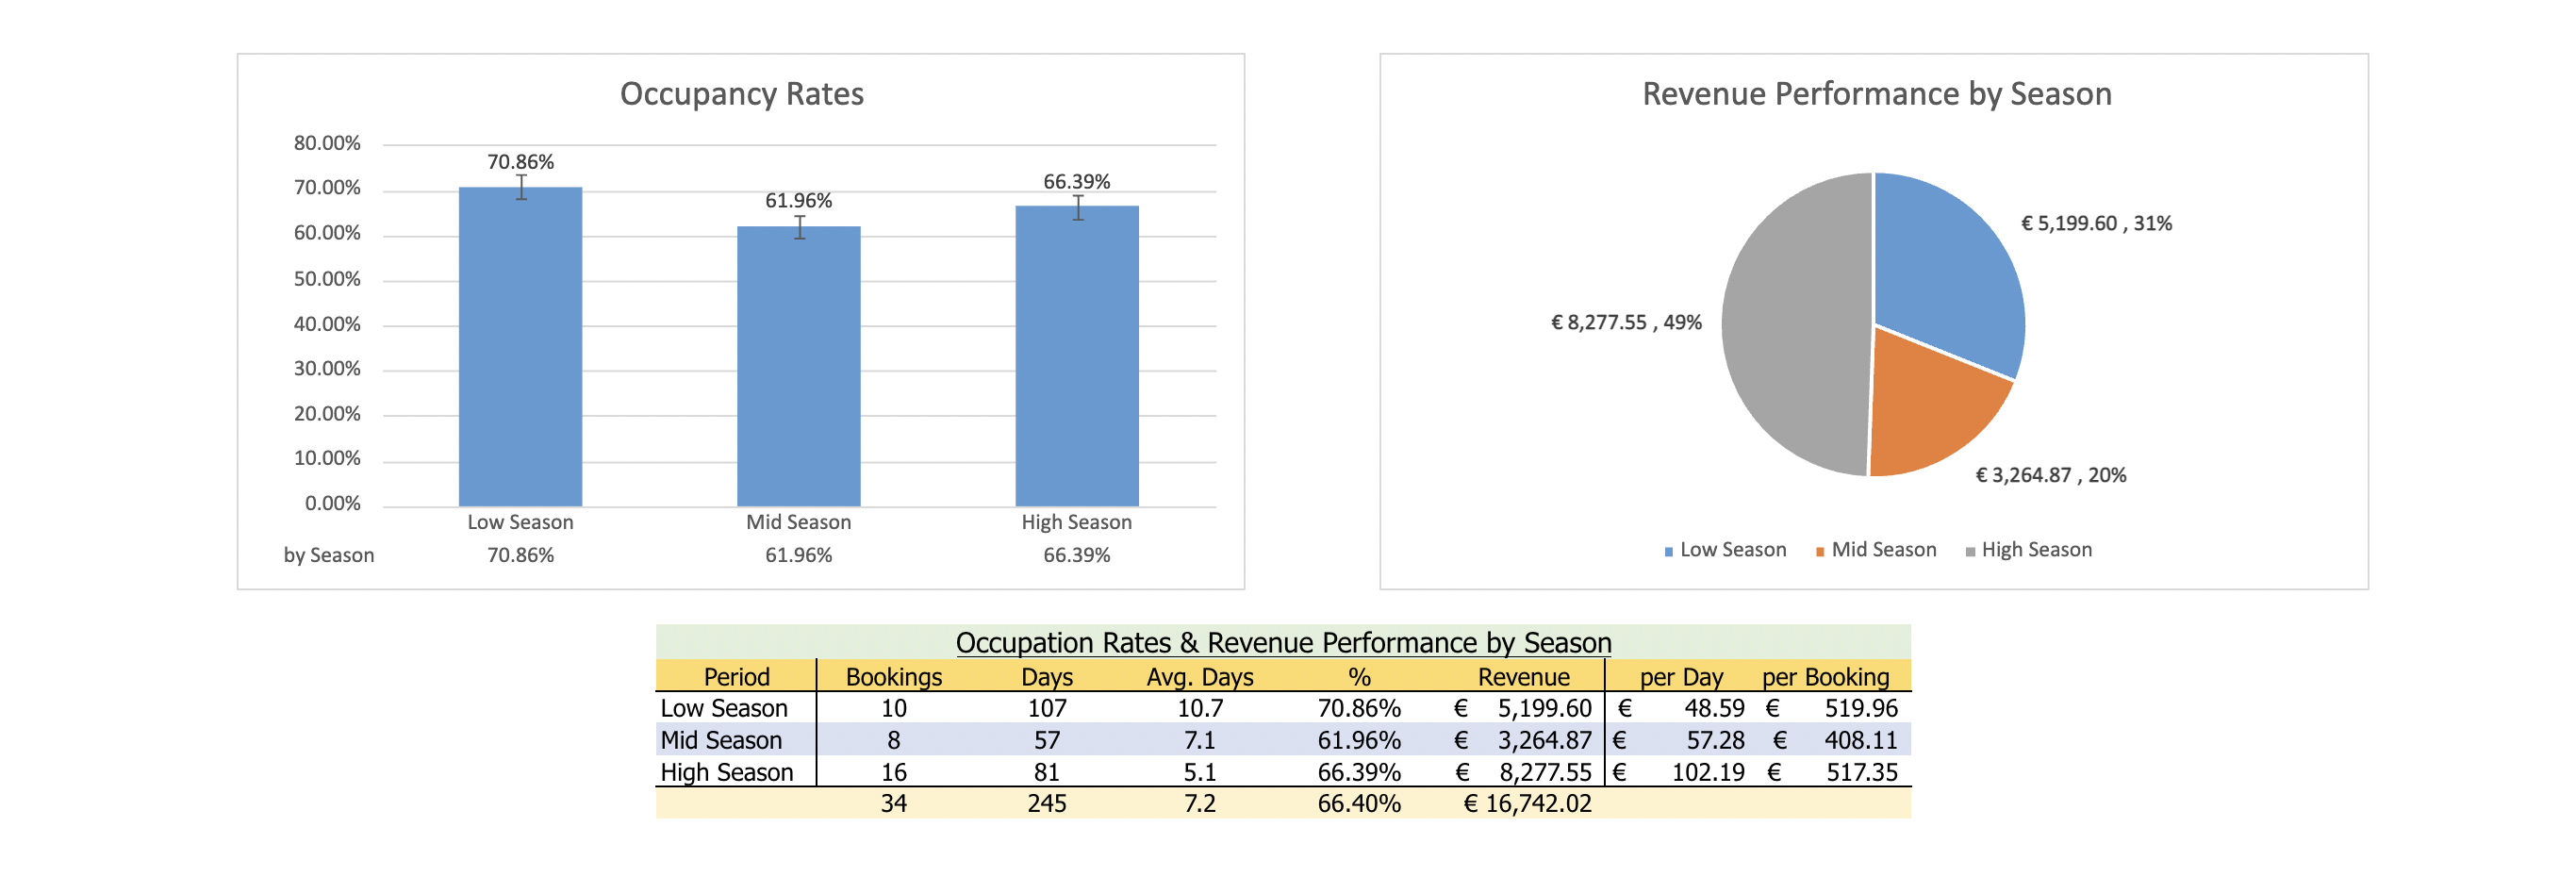
OCCUPANCY RATES & REVENUE BY SEASON
Subsequent charts and tables offer insight into key metrics across three designated booking seasons: Low, Mid, and High. These metrics encompass booking quantity, days sold, average booking duration, revenue generated, and average daily and booking rates, providing owners with a comprehensive overview of seasonal performance trends.
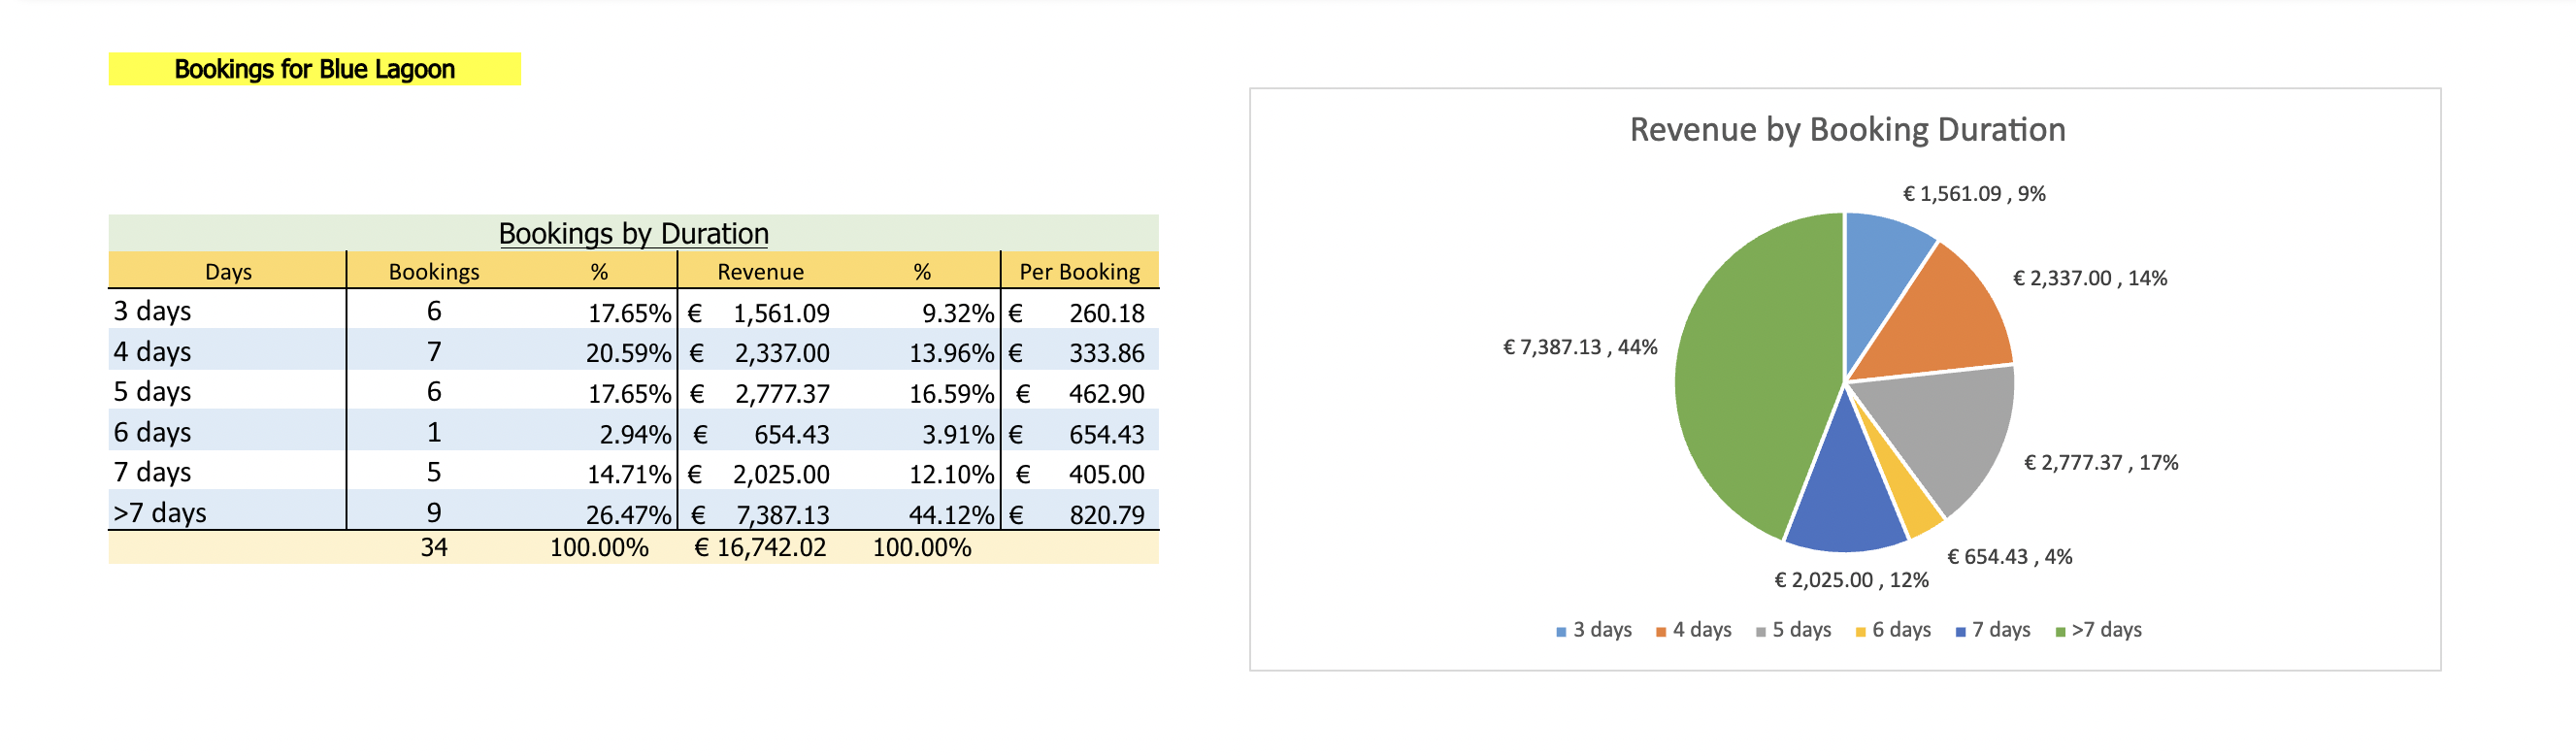
BOOKINGS AND REVENUE BY BOOKING DURATION
Addressing concerns regarding optimal booking durations, a dedicated chart and table analyze bookings by duration, shedding light on the impact of varying stay lengths on overall property performance. This information aids in potentially determining the ideal minimum night stay, thereby optimising revenue potential.
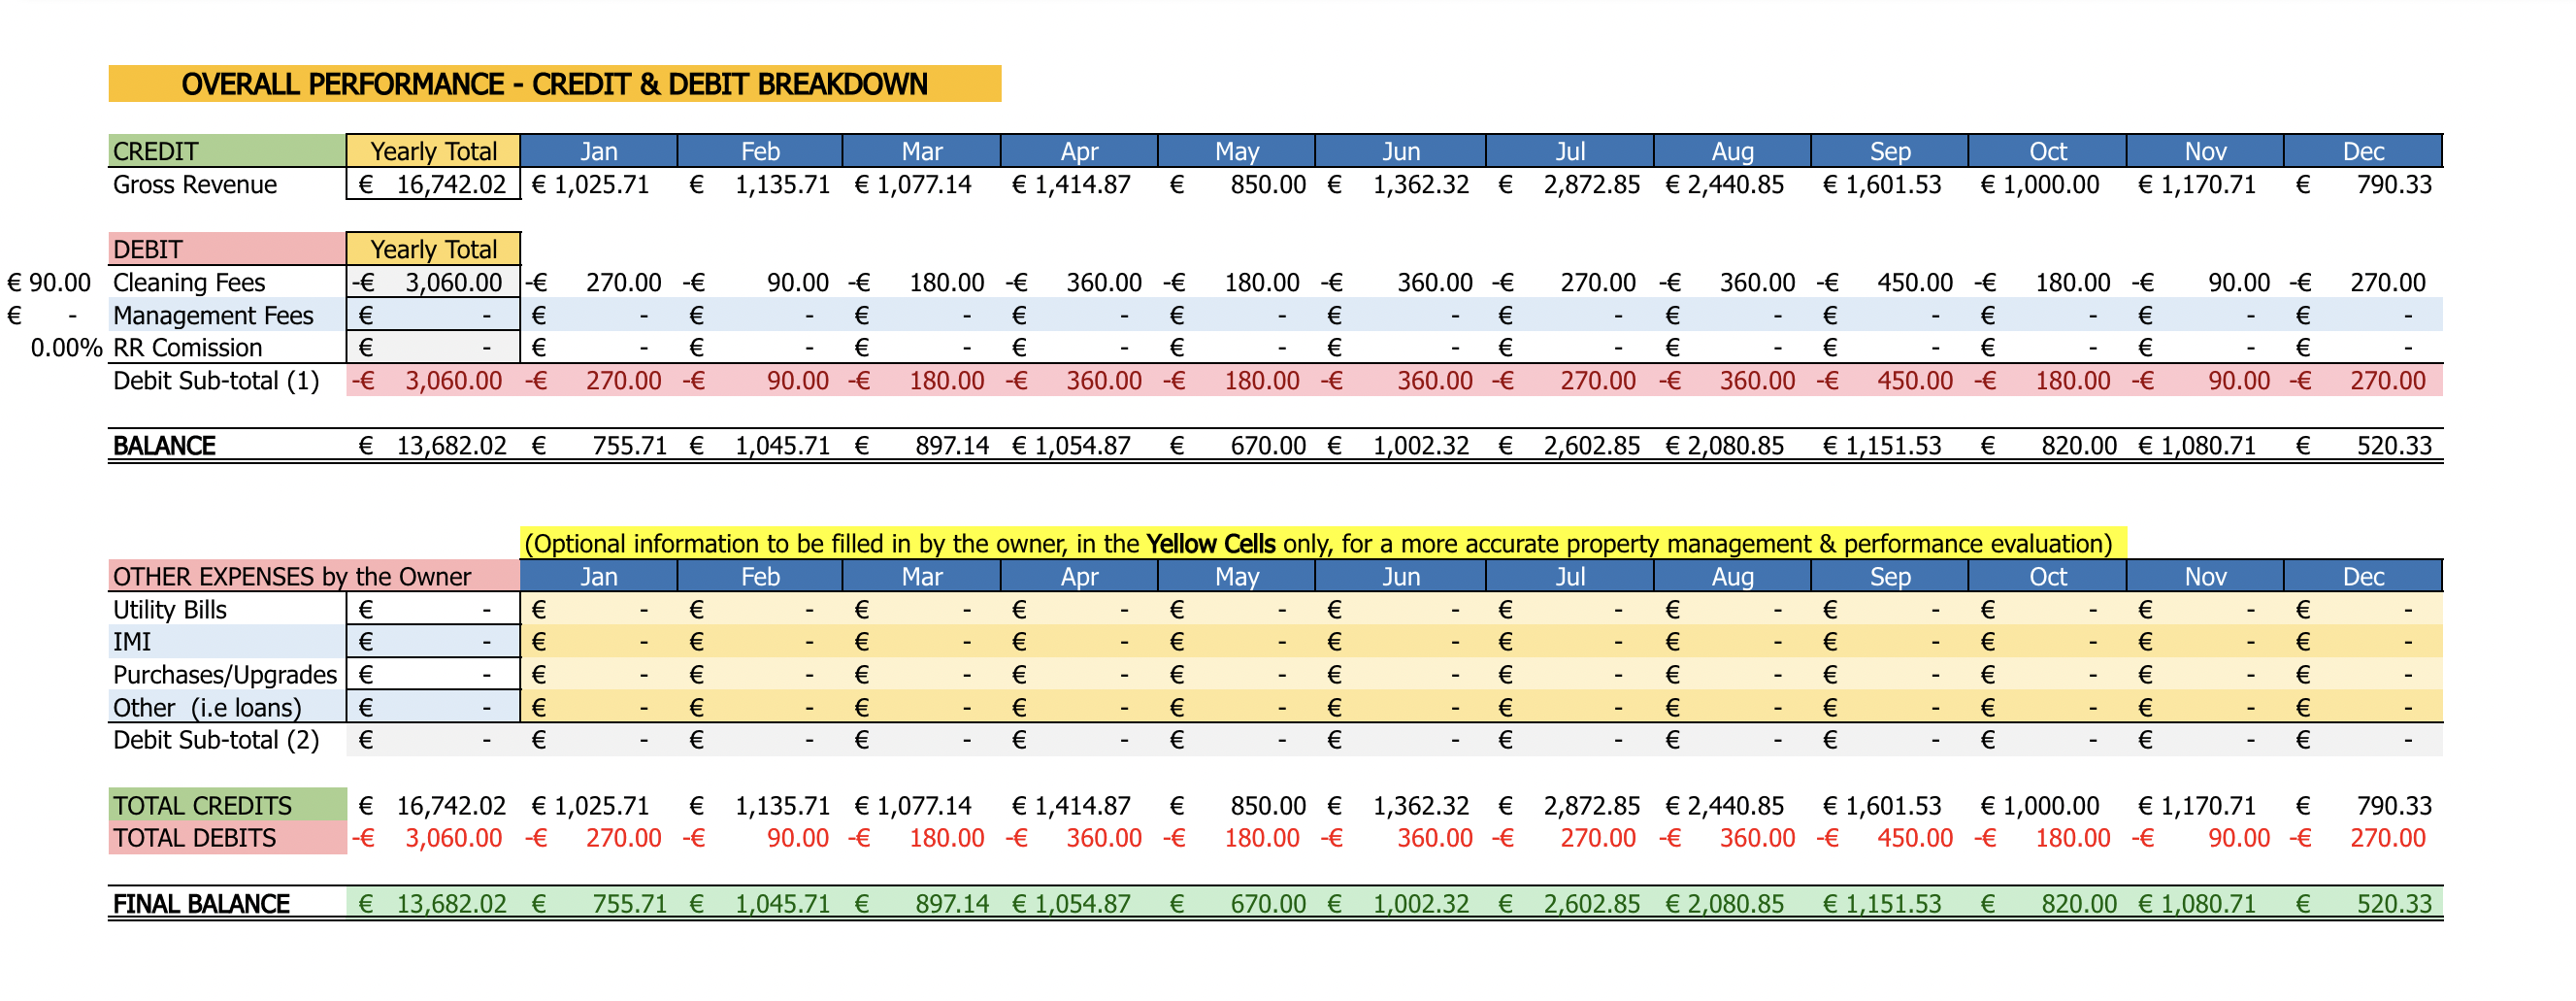
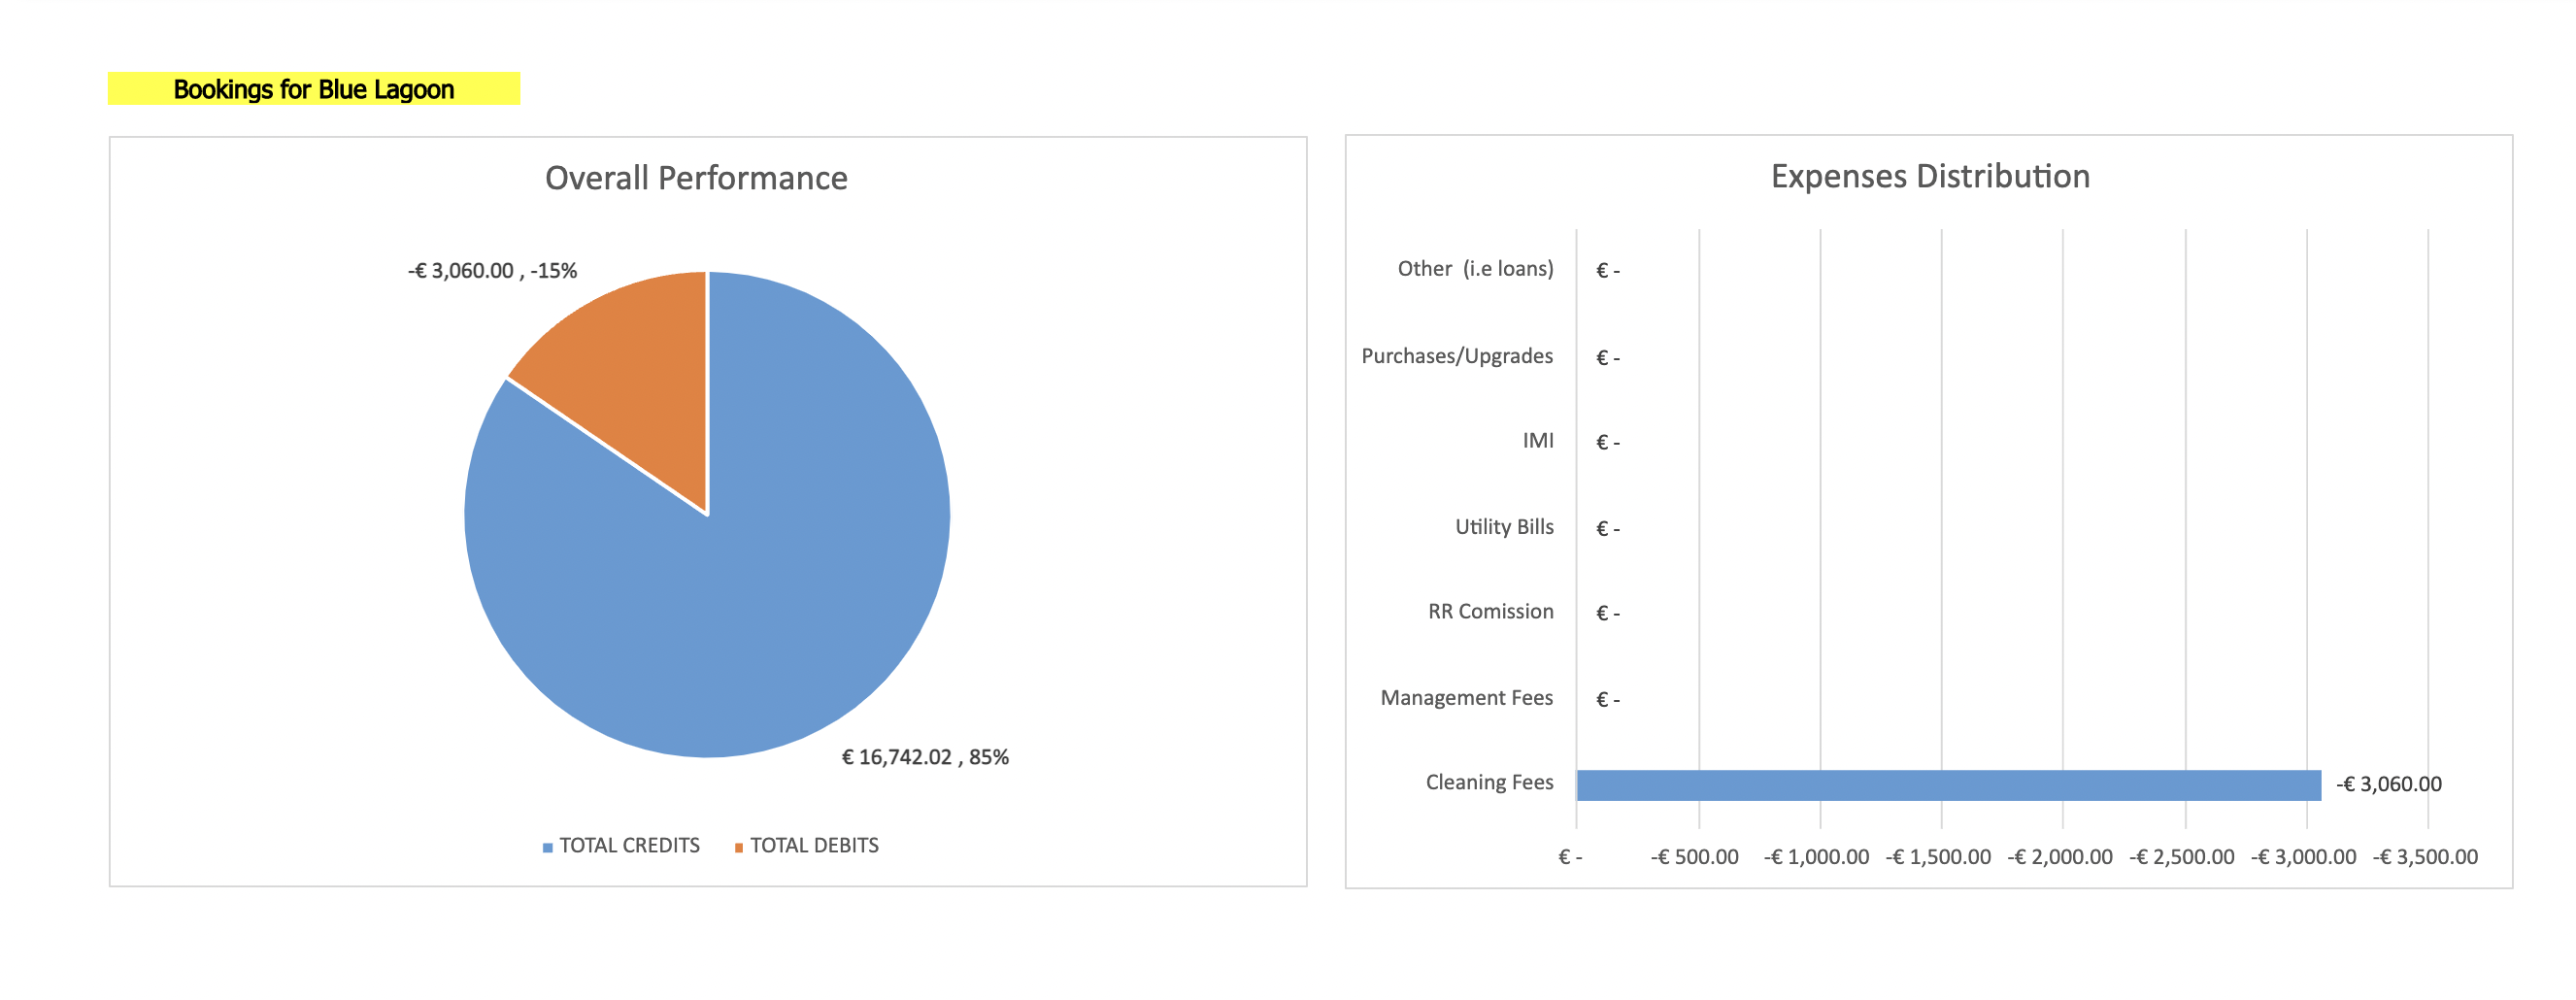
OVERALL PERFORMANCE - CREDIT & DEBIT BREAKDOWN
Additionally, the Owner Dashboard includes two tables resembling a balance sheet, enabling owners to track property credits and populate fields with related debit values. This feature enhances accuracy in assessing overall property performance, considering all financial transactions.
Accompanying these tables, visually intuitive charts offer a clear depiction of property performance and profitability, facilitating owners' understanding and strategic decision-making.
The fields highlighted in yellow and orange within the second table are customisable and serve as a valuable resource for property owners seeking a precise assessment of their property's annual profitability. By inputting relevant debits associated with property operations, to counter with the already provided credit values, owners can gain insight into the true financial performance of their investment. This feature empowers owners to make informed decisions regarding operational strategies, financial planning, and overall property management, contributing to long-term sustainability and success.
MARKETING
Concluding the feature set, a section provides property owners with direct access to their property's advertisements, allowing them to evaluate listing quality, review visual content, and assess guest feedback for continuous improvement.
In summary, the Owner Dashboard represents a comprehensive suite of tools designed to empower property owners in optimising performance, maximising revenue, and ensuring guest satisfaction in today's competitive hospitality landscape.